Experience Insights
Overview
Experience Insights lets you analyze your experience performance to understand how experiments and personalizations are serving your goals.
By tracking the performance of personalizations and experiments, marketers and data analysts gain actionable insights, enabling data-driven decision making. It provides statistical analysis without creating yet another source of truth, integrating directly into your current data workflow.
NOTE: To use Experience Insights, you must first set it up. For more information on how to set up Experience Insights, see the Insights setup in the developer documentation.

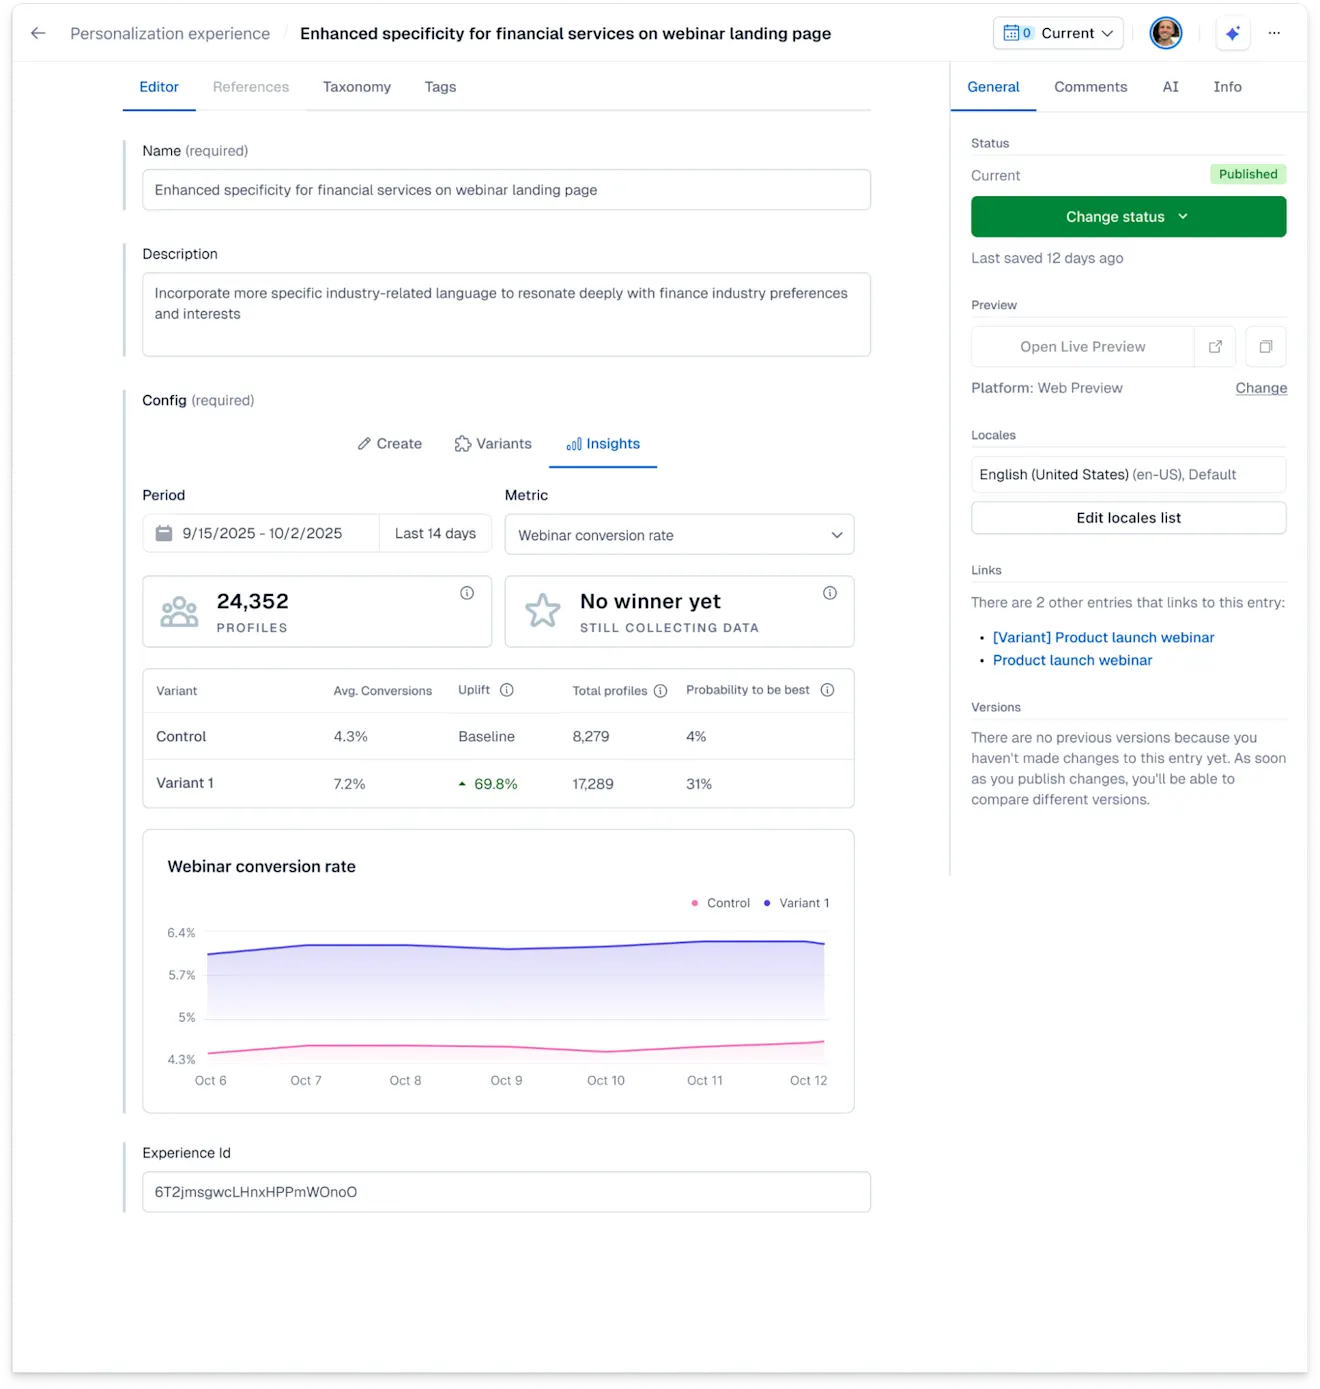
Experience Insights provides you with clear data for every experiment or personalization, such as:
Profiles – The number of unique visitors in the selected time period that saw the control or any of the variants.
Winning variant – The variant with at least one conversion and 100 profile views and a Probability to Be Best (P2BB) of at least 95%.
Average conversion value – Displayed for Value metric type. The average value per session/user that saw the experience within the selected time range and scope.
Conversion rate – The number of conversions divided by the number of profiles that saw the experiment or personalization for the selected metric.
It also enables you to compare the performance of individual variants. Every experience with a set holdout/control group is eligible for performance comparisons. We compare variants with measures such as Uplift and P2BB, giving you clear insights into what performs best, using Bayesian inference.
The data is updated every hour.
How to evaluate the performance of an experience
To evaluate the performance of experiences:
Log in to the Contentful web app.
Navigate to the "Content" tab, and select the experience entry.
Click on the Insights tab.
Under Period, select the reporting time frame for your experience.
Under Metric, select the metric for which you want to get insights.
NOTE: Make sure you have set up your desired metrics before the start of an experiment or personalization. You can always add metrics at a later stage. However, they will only be available from the time that they have been set up.
The page now shows information for all defined variants with respect to the selected period and measure.
NOTE: As a rule of thumb, we recommend running each experience for at least 2 weeks before making any decisions based on performance analysis. However, P2BB adjusts automatically with the number of profiles and conversions, and, depending on the traffic an experience receives, statistically significant results may be available sooner.
How it works
Variants
A variant is a link from an experience to a Contentful entry. Typically, an experience has at least two variants:
Control – Also known as “baseline” or “holdout,”. It references a Contentful entry with the default or un-personalized version of your content.
Variant 1 – Variants reference the Contentful entries that serve as variants or personalized content .
If you are running an Experiment with multiple variants, you will be presented with more values, accordingly.
Each variant needs a reach of at least 100 profiles and at least one conversion. The reach measures the number of profiles any variant has reached in the given time period.
Conversion rate or conversion value
Conversions measure the success of how many sessions or users have reached the given metric goal in the given time period. Depending on the metric, there are two ways how conversions are displayed:
If the metric is a "binary" metric, the conversion rate is evaluated. It displays what percentage of sessions or users have first seen the given experience and then reach the conversion goal.
If the metric tracks a "conversion value", the average value for that conversion is displayed. Sessions or users must first see the given experience and then achieve the conversion goal. For every session or user that has not achieved any conversion goal or only seen the given experience afterwards, the value 0 is added to the overall average.
Uplift
The uplift measures the relative lift or drop of the conversion rate or conversion value compared to the control group. It is calculated using Bayesian inference, the industry standard for statistical experiments. Combined with the P2BB, the uplift is a leading measure to derive action items from the analysis.
Reach
Reach measures the number of profiles any variant has reached in the given time period.
Probability to Be Best
The Probability to Be Best (P2BB) measures the likelihood that the individual variant is the best out of all given variants and is based on Bayesian inference and Monte Carlo simulations. The two contributing factors to this measure are the reach of each variant and the relative uplift. Therefore, the Probability to Be Best is a robust method to make a statistically significant decision for winning variants.
Example
Imagine you run an experiment for a few days. After several days, it has only reached a few hundred users. Now, even if one of your variants shows a high uplift of 50%, the P2BB might still not be significantly high.
Similarly, if your experiment reaches a large number of users but no variant is performing at a much higher rate, the P2BB will not decide on any winner, and the No winner yet state is displayed in the Insights.
Declaring a winning variant
A variant is declared a winner if it has at least one conversion and 100 profile views and a P2BB of 95%. This means that any variant that meets the requirements with a P2BB that is equal or higher than 95% will receive a "winner" tag.
NOTE: The tag is only descriptive. Experience Insights does not take any further action besides highlighting a winner. Depending on whether you are analyzing the performance of an experiment or a personalization, you might derive different action items.
For experiments
If a winning variant has been chosen for an experiment, you might want to:
Turn that variant into your new baseline.
Use that new variant as a new personalization.
Create a new experiment with yet another variant to keep testing what works best.
For personalizations
If a winning variant has been chosen for a personalization, you might want to:
Decrease the holdout percentage.
Add more components to your personalization to increase the uplift even further.
Create an experiment for the same audience to see how you can improve your personalization.